
Extreme Fear grips the stock market
Extreme Fear grips the stock market
Pop goes the bubble—$6.6 trillion in value destruction.

A few thoughts about the market correction. The market could fall another 10% or more. The previous low is a key point because a move below it could mean no rebound after the recent correction. This suggests, as an example, the S&P 500 Index could test 3800 before any meaningful rebound. However, any good news about the Russian invasion of Ukraine should result in a sharp rebound. The risk is that the rebounds go to lower highs and sell-offs to lower lows. In other words, the market trends downward toward a new ‘fair’ value based on the fundamentals of a new [lower] long-term growth rate of the economy and higher interest rates.

The Wilshire 5000 has fallen 13.6% from its peak. This represents a loss of $6.6 trillion in market value for investors. From $48.8 trillion on January 3, 2022 to $42.2 trillion at the close on March 7, 2022. The market typically rebounds after a major selloff, when there is blood in the street (extreme fear). However, the risks are on the downside as the economy contracts towards its long-term potential growth of 1.8%. A recession will likely occur sometime over the next two years as the Fed tightens and stimulus spending winds down. $130+ oil is a headwind and it reduces consumer spending and economic growth. Corporate revenue and earnings follow GDP over time.
The Wilshire 5000, is a market-capitalization-weighted index of the market value of all American-stocks actively traded in the United States.

When bubbles go vertical it’s almost impossible to predict the top, even when it is obvious the market is in its final stages. When it breaks, it’s a good bet that it’s going a lot further. Fear takes over and people panic. For many it is a chance to cash out before the market takes it all back. The end of a bubble is typically the break in the vertical and the failure to make a sharp comeback.
Seven Fear & Greed Indicators
Updated Mar 7 at 4:00pm
Investors are driven by two emotions: fear and greed. Too much fear can sink stocks well below where they should be. When investors get greedy, they can bid up stock prices way too far. So what emotion is driving the market now? CNNMoney's Fear & Greed index makes it clear.


Junk Bond Demand—Fear
Investors in low quality junk bonds are accepting 1.80 percentage points in additional yield over safer investment grade corporate bonds. This spread is higher than what has been typical for the last two years and indicates that investors are risk averse. Last changed Feb 25 from a Neutral rating

Stock Price Strength—Extreme Fear
The number of stocks hitting 52-week lows exceeds the number hitting highs and is at the lower end of its range, indicating extreme fear. Last changed Jan 20 from a Fear rating.

Stock Price Breadth—Extreme Fear
The McClellan Volume Summation Index measures advancing and declining volume on the NYSE. During the last month, approximately 10.45% more of each day's volume has traded in declining issues than in advancing issues, pushing this indicator towards the lower end of its range for the last two years. Last changed Feb 22 from a Fear rating.

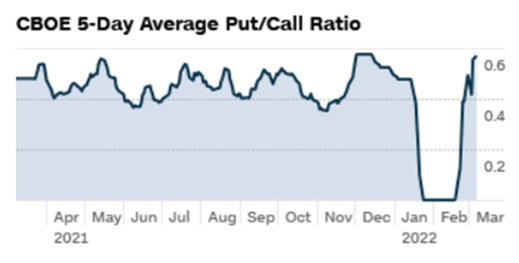
Put and Call Options—Extreme Fear
During the last five trading days, volume in put options has lagged volume in call options by 42.89% as investors make bullish bets in their portfolios. However, this is still among the highest levels of put buying seen during the last two years, indicating extreme fear on the part of investors. Last changed Feb 25 from a Fear rating.
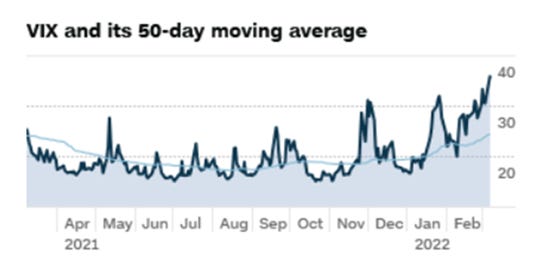
Market Volatility—Extreme Fear
The CBOE Volatility Index (VIX) is at 36.45 and indicates that investors remain concerned about declines in the stock market. Last changed Feb 25 from a Neutral rating.
Market Momentum—Extreme Fear
The S&P 500 is 7.41% below its 125-day average. During the last two years, the S&P 500 has typically been above this average, so rapid declines like this indicate extreme levels of fear. Last changed Jan 14 from a Fear rating.

Safe Haven Demand—Extreme Fear
Bonds have outperformed stocks by 8.28 percentage points during the last 20 trading days. This is close to the weakest performance for stocks relative to bonds in the past two years and indicates investors are fleeing risky stocks for the safety of bonds. Last changed Feb 28 from a Fear rating.
