


Recession and supply cuts by OPEC
Expect a lower stock market, higher oil prices, and a contracting economy as the Fed keeps the Fed Funds rate higher for longer.

Summary
The US economy is expected to enter the recession in Q2 2023.
The S&P 500 is still overvalued, and earnings expectations don't yet reflect an imminent recession.
Thus, there is a considerable downside to stock market.
Expect Higher Gasoline Prices as OPEC Makes a Surprise Cut in Supply
Three phases to the expected stock market bear market:
Phase 1 is the Fed-induced Liquidity selloff. During this Phase 1, the Fed tightens the monetary policy, which bursts the asset price bubbles and causes the contraction in PE multiple. The 2022 selloff was the Fed-induced Liquidity selloff, which caused the contraction of S&P 500 PE ratio from 35 to 18, and busted the bubbles in cryptocurrencies, meme stocks, tech, and other speculative bets.
Phase 2 is the Recessionary selloff. The Fed's tightening policy usually causes a recession, during which corporate earnings decline, and the PE ratio further contracts. We are about the enter this stage.
Phase 3 is the major Credit Crunch caused by the deeper and longer recessions, during which the credit spreads spike, as the overleveraged corporate/consumer/government sectors default on loans, hedge funds collapse due to margin calls, and the counterparty risk freezes the credit markets. Not all recessions end with the credit crunch, and it's too early to predict whether the current cycle will produce the major credit crunch.
This is the chart for the ETF that tracks the S&P 500 (NYSEARCA:SPY). The Liquidity based selloff started with the rise in 2Y yields in January 2O22 due to expectations of monetary policy tightening. There have been two major bear market rallies based on the expectations of the "Fed pivot". The Banking Crisis in March of 2023 is the turning point, which transitions the Liquidity Selloff into the Recessionary selloff - as it acts as the catalyst for recession due to the resulting credit tightness.

When is the recession coming?
This is the sample of what appears to be the consensus on Wall Street at this point:
The Conference Board sees the recession starting in Q2 of 2023, and last for three quarters, until Q1 2024. Here is the quote and the recent forecast:
US GDP growth defied expectations in late 2022 and early 2023 data has shown unexpected strength. The US economy, and especially the US consumer, has resisted the duel headwinds of high inflation and rising interest rates. Because of this, we are increasing our Q1 2023 forecast to 1 percent. However, we continue to forecast that the US economy will slip into recession in 2023 and expect GDP growth to contract for three consecutive quarters starting in Q2 2023. These changes to the quarterly forecast result in an upgrade to our annual forecast for 2023 and a downgrade to our annual forecast for 2024.

ING agrees, they also see the US recession in Q2 2023 and lasting for three quarters:

ING 3/31/2023
Blackrock weekly commentary as of March 27th, 2023 not only sees the recession forthcoming, but also sees the Fed keeping the monetary policy tight during the recession:
Markets have been quick to price in rate cuts as a result of the banking sector turmoil and the Fed signaling a coming pause. We don't see rate cuts this year - that's the old playbook when central banks would rush to rescue the economy as recession hit. Now they're causing the recession to fight sticky inflation - and that makes rate cuts unlikely, in our view. Stocks have held up due to hopes for rates cuts that we don't see coming.
Blackrock 3/27/2023
This is a sample, but it represents the Wall Street consensus, the US economy is likely to be in a recession, possibly in Q2 2023 - that's next week. Also, Wall Street seems to agree with the Fed, there will be no rate cuts this year, despite the recession.
Implications for S&P 500
S&P 500 is exiting the Fed-induced Liquidity selloff with still overvalued forward PE ratio at 18. More importantly, the earnings for S&P 500 have not been revised lower by bottom-up analysts. Thus, not only we can expect the selloff due to the expected downside revisions of corporate earnings, but also the selloff due to further contraction of the PE ratio down to the 15 level. Thus, there is a considerable downside to S&P 500. The contraction in the P/E alone could bring the S&P 500 down 15-17%—without the downward revision in estimated earnings.
The chart above shows that SPY has been stuck in the range which corresponds to about 3700-4200 on S&P 500 (SP500).
The October bottom was due to the expected Fed pivot - before the recession arrives, which is a possible scenario, but at this point this is unlikely due to (at this point really) an imminent recession. The market tends to bottom out during the recession which could extend into early 2024.
SPY is up around 5.5% YTD in 2023, but the gains are unproportionally driven by the big tech stocks in Communications (XLC), Discretionary (XLY) and Technology (XLK) sectors. This could be due to the specific AI theme, also due to lower interest rates since October, but I think it's mostly a bear-market bounce from the deep selloff in 2022 and driven by short-covering and retail investor inflows.

In fact, Goldman Sachs states in the March issue of Market Pulse that the stock market performance this year is driven by short-covering:
MOMENTUM: This year's rally has been driven by short covering, fueling a liquidity comeback. We anticipate momentum and technical factors to further elevate market volatility. In this environment, we believe managed futures may be able to exploit such opportunities.
What's next?
The near-term recession will have to be confirmed with the data. Wall Street does not expect a sharp increase in the unemployment rate, but we do have to see some weakness in the weekly initial unemployment claims. The Federal Reserve is expecting the unemployment rate to increase to 4.5% from February’s 3.6% by the end of the year. This would increase unemployment by about 1 million.
More importantly, the earnings season will have to support the expected decline in earnings via downgrades in earnings guidance from the cyclical companies, and especially the banks, which have to confirm the expected credit tightness.
Longer term, all recessions end with the policy support: monetary and fiscal. This time, however, the monetary policy support is limited by sticky inflation, which the Fed expects to remain above its target rate 2% at least through 2024. Further, the political divide in the US political sphere will make it very difficult to pass any effective policy support - especially before the 2024 election. This increases the probability of a deeper and longer recession.
Expect Higher Gasoline Prices as OPEC Makes a Surprise Cut in Supply
Fresh on the heels of an announced oil cut by Russia, OPEC follows up with cuts across the board.
Surprise OPEC Announcement
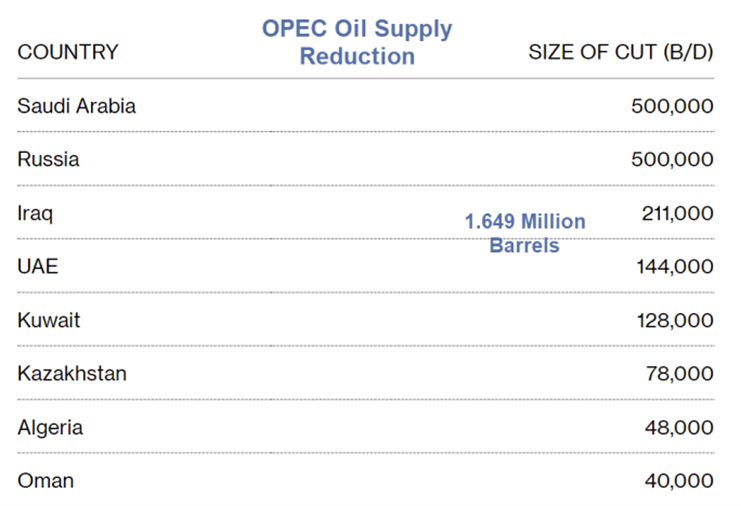
The initial cut is 1.1 million barrels then increases to 1.6 million barrels by August.
OPEC+ Makes Surprise 1 Million-Barrel Oil Production Cut
OPEC+ announced a surprise oil production cut that will exceed 1 million barrels a day, abandoning previous assurances that it would hold supply steady to maintain a stable market.
That’s a significant reduction for a market where — despite the recent price fluctuations — supply was looking tight for the latter part of the year. Oil futures weren’t trading when the cut was announced on Sunday, but the inevitable price reaction could add to inflationary pressures across the world, forcing central banks to keep interest rates higher for longer and amplifying the risk of recession.
In October last year, when OPEC+ made a surprise production cut of about 2 million barrels day just weeks before the US midterm elections, Biden vowed there would be “consequences” for Saudi Arabia. But the administration did not follow through after and the White House has recently praised several Saudi initiatives, including its decision to supply Ukraine with $400 million in energy and financial assistance.
All fourteen traders and analysts polled last week by Bloomberg predicted no change. They were taking their lead from Saudi Energy Minister Prince Abdulaziz bin Salman, who had said last month that the current OPEC+ production targets are “here to stay for the rest of the year, period.”
Daily Technicals
On the daily chart, the breakdown below $70 now looks like a head fake. Price is back in a technical channel whose bottom is $70-$73 and the top $80-83 or so.
Strong resistance is at the $83 level and above that $94.
Expect a run to the $90-$94 level.

Political and Economic Complications
A strong move higher in the price of crude, especially in the surprise manner that it will happen will complicate US Mideast policy and exacerbate the struggles at the Fed to get inflation under control.
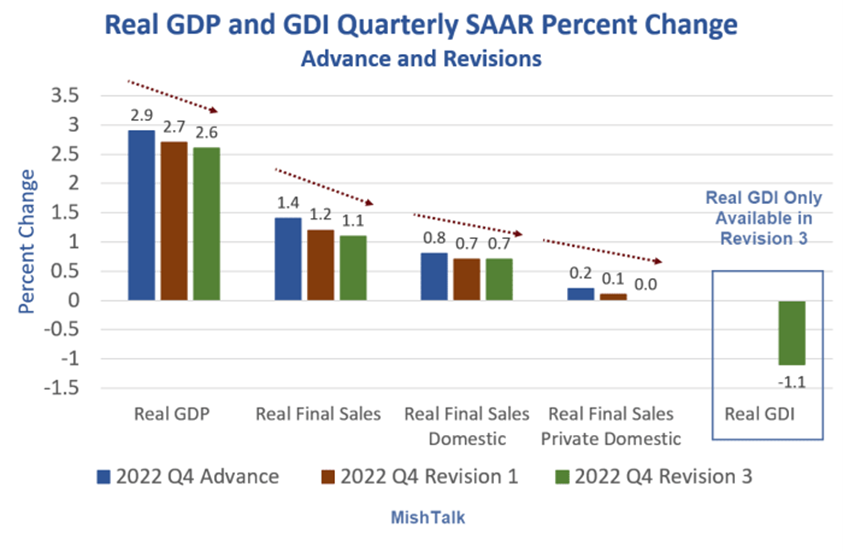
Real Income Was Negative in 2022 Q4, Big Negative Revisions to GDP
The brief bout of economic optimism that marked the start of this year, sparked by some surprisingly strong data, has long worn off and the recent banking turmoil has undermined the confidence of investors and businesses.
A raft of big Wall Street names and other experts are now issuing fresh warnings of an impending recession that could cripple corporate earnings and send stocks tumbling. Jeffrey Gundlach, David Rosenberg, Morgan Stanley's Mike Wilson and Wharton professor Jeremy Siegel are among those who have sounded the alarm on an oncoming economic downturn.
The latest economic commentary from top voices is sounding a distinct note of caution about increased economic risks. Below is a selection of the most recent recession warnings from high-profile investors, analysts and other experts.
Jeffrey Gundlach, DoubleLine CEO
"The economic headwinds are building, we've been talking about this for a while, and I think the recession is here in a few months," the veteran investor told CNBC on Monday.
Mike Wilson, Morgan Stanley's chief US equity strategist
"Markets go through these periods I call a rolling bear market [or] rolling recession," Wilson told Bloomberg TV on Monday. He noted this week that the stock market is facing the highest risk of downside in the past year.
David Rosenberg, Rosenberg Research president
"No recession? Well, there sure is one in corporate profits, with today's revised Q4 GDP report showing that pre-tax earnings collapsed at an -18% annual rate for the second straight quarter and contracting on a YoY basis for the first time since 2020 Q2," the veteran economist tweeted Thursday.
BlackRock, world's largest asset manager
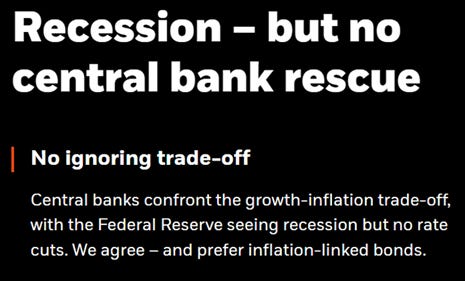
"Central banks confront the growth-inflation trade-off, with the Federal Reserve seeing recession but no rate cuts. We agree," Wei Li, global chief investment strategist at BlackRock, wrote in a report published this week.
"We don't see rate cuts this year – that's the old playbook when central banks would rush to rescue the economy as recession hit. Now they're causing the recession to fight sticky inflation – and that makes rate cuts unlikely, in our view," she said.
Jeremy Siegel, Wharton professor
"The risk of recession has increased clearly," the author of "Stocks for the Long Run," warned in his weekly commentary for WisdomTree, published Monday.
"The economic data last week was mixed: initial jobless claims came out on the strong side, below 200,000, but we got a very weak durable goods report," he added.
Robert Shiller, Yale economist
"We have smart people on the Fed and the Treasury Secretary I admire, Janet Yellen," the Yale economist said Monday. "They may have to accept something of a recession."
Nicholas Colas, DataTrek co-founder
"The default scenario baked into asset prices is based on the Fed pivoting - quickly - to lowering policy rates. That can only mean a recession is close at hand, one that would reduce inflation and be steep/deep enough to force the Fed to act," said DataTrek's co-founder.
How long do bull and bear markets last?
As of June 13, 2022. Reflects S&P 500 Index. Source: RBC GAM, Bloomberg. An investment cannot be made directly into an index. The graph does not reflect transaction costs, investment management fees or taxes. If such costs and fees were reflected, returns would be lower. Past performance is not a guarantee of future results. Bull market starts from lowest close reached after market has fallen 20% or more. Bear market starts from when the index closes at least 20% down from its previous high.

Key take-aways
Bear markets come in all shapes and sizes. Some bear markets are mild and quick, like the one in 1957 where U.S. equities fell 20.7% and then began to recover in about 3 months. Other bears have been quite severe. For instance, during the global financial crisis, U.S. equities fell nearly 57% during a bear market that lasted roughly a year and a half.
Long-term resiliency of markets. Regardless of the severity or length of the pullback, markets have always recovered along the path to achieving new highs.
Lower asset prices should lead to higher long-term returns. Trying to time the bottom of a bear market is next to impossible. That said, regardless of when people invest during a bear market, history suggests they usually see positive subsequent returns over the long term.
The chart below shows that each time the market has dropped by a significant amount, the bounce back in the following year has also been significant. This pattern has repeated across bear markets since 1950.

Source: RBC GAM, Bloomberg. S&P 500 TR (USD). Data reflects time period of January 1, 1950 to February 29, 2020. Subsequent 1-year return reflects the median 1-year return. An investment cannot be made directly into an index. The graph does not reflect transaction costs, investment management fees or taxes. If such costs and fees were reflected, returns would be lower. Past performance is not a guarantee of future results.
